
Pharmacokinetics
Kinetic Overview
- Pharmacokinetics-what the body does to the drug
- Absorption
- Distribution
- Metabolism
- Excretion
- ADME-important to keep in mind for all drugs and all PT types
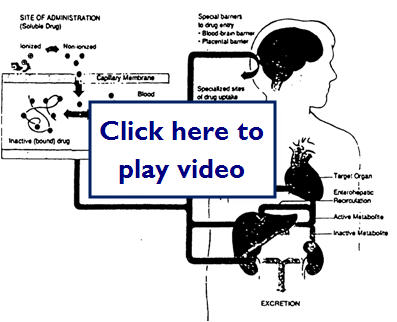
We just learned that kinetics is what our body does to the drug. This diagram illustrates possible paths for a drug after it is absorbed:
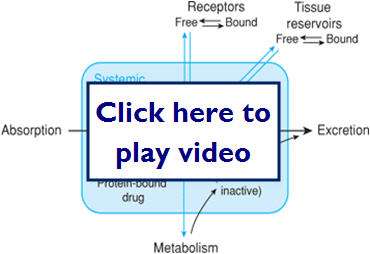
- Barriers drugs must overcome to reach the target site are
- Physical-route to enter body
- Chemical-acidic environments
- Biological-blood brain barrier, placental barrier, cell membrane
- Biological membranes
- Lipid bilayer membrane
- Hydrophillic surface with a hydrophobic lipid core
- Traversing the membranes
- The hydrophobic core of biological membranes presents the major barrier to drug transport
- Small nonpolar, lipophillic, and unionized drugs can cross via passive diffusion
- Other larger polar drugs need help
- Facilitated diffusion
- Active transport (requires energy)
- Rate of diffusion depends on the concentration gradient (Fick's Law)
- This applies when there are no complications
- Drug is small, unionized and lipophillic
- The drug will diffuse along the concentration gradient until equilibrium is reached (molecules moving in = those moving out)
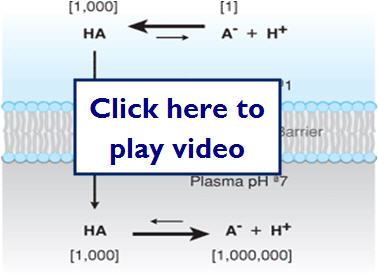
PH (ION) trapping can occur when an unionized drug crosses the membrane, but due to the conditions of the environment (PH) on the other side, the molecule becomes trapped. The amount of trapped drug is determined by the pKa (dissociation constant) of the drug and the PH of the environment (NSAIDs are a good example of this).
The following illustration shows how ionization can effectively trap molecules on one side of a membrane:
- Blood brain barrier
- Has tight junctions that does not allow most drug to pass by passive diffusion
- Drugs need to be small and lipophillic or use existing transport proteins in the blood-brain barrier to pass through
- Hydrophillic drugs can pass if they target facilitated or active transport proteins of the blood-brain barrier
- Can infuse drugs directly into the cerebrospinal fluid (CSF)
Absorption
- Absorption
- Bioavailability- amount of drug available to the target organ
- Bioavailability = quantity of drug reaching systemic circulation/quantity of drug administered (only applies to drugs that reach their target site by systemic circulation)
Let's take a look at how drugs are absorbed in the body...

![]()
This content requires Flash Player 10 or higher. 
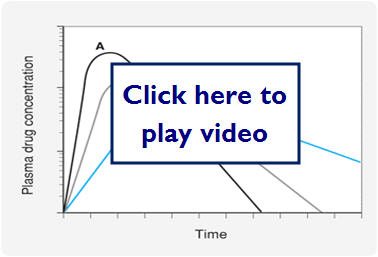
Here is an example of two different drug formulations which have very different peaks:
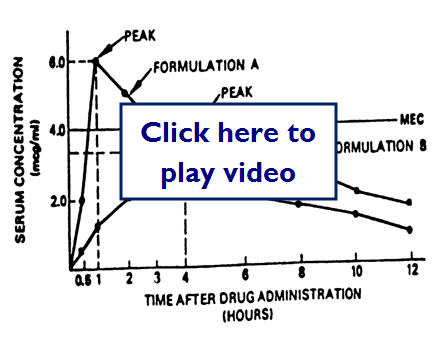
Here we have two different drug formulas but the MEC (minimum effective concentration) is lower:
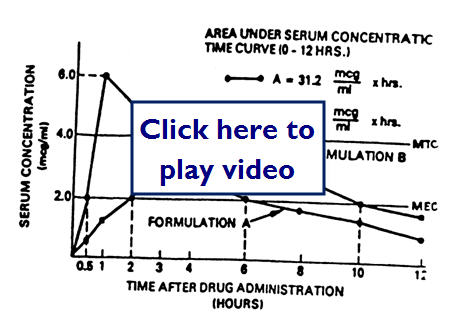
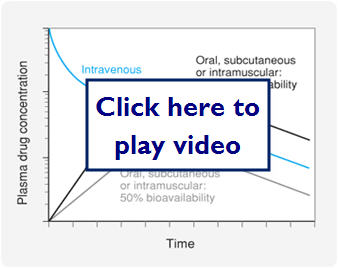
Let's look at a graph comparing IV dosing, oral dosing with 100% bioavailability, and oral dosing with 50% bioavailability:
- Administration routes
- Enteral (PO)--Simplest of drug routes, but exposes drug to harsh acidic and basic environments that can limit absorption. After absorption in the GI drugs go to the liver where they experience the 1st pass effect. Liver enzymes metabolize a fraction of the drug reducing the drug concentration systemically available.
- Parenteral-Drug is delivered directly in to systemic circulation or tissue space
- SC-subcutaneous
- IM- intermuscular
- IV-intervenous
- IT-intrathecal
Let's take a look at some examples of these:
![]()
This content requires Flash Player 10 or higher.
![]()
This content requires Flash Player 10 or higher.
- Mucus membrane
- Sublingual, ocular, pulmonary, nasal, rectal
- Advantages
- Rapid absorption
- Convenience
- Avoid harsh GI and 1st pass effect
- Transdermal
- Absorbed through skin
- Drugs must be highly lipophillic
- Good for drugs that need slow and continuously administered
Let's look at a graph of some different bioavailabilities:
- Factors affecting absorption
- Blood flow -greatest effect
- Surface area
- High/rapid dose
![]()

![]()
![]()
Distribution
- Volume of distribution (Vd)
- Vd= Dose/(drug concentration)plasma
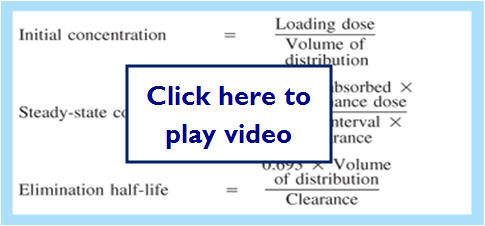
- Can be manipulated to find the loading dose given the Vd (can be estimated)
- Loading dose= Vd x (drug concentration) plasma SS concentration needed for therapeutic effect
- Factors that affect Vd
- Tissue distributed to (muscle, adipose, hepatic)
- Volume or mass of the tissue
- Number of binding sites in tissue
- A drug that has a higher Vd than another equally potent drug will take a higher initial dose to reach a therapeutic concentration
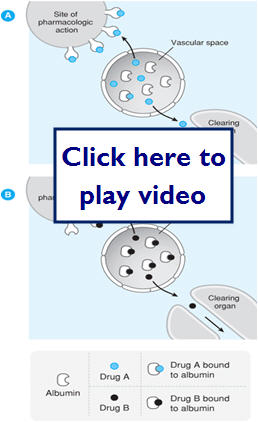
- Protein binding-proteins can bind (inactive)to a large percentage of a drug and only a small percentage remains free(active)
- Coadministration of other drugs can affect the percentage of bound drug (Warfarin)
Let's take a look at a video clip of volume of distribution in the body:
![]()
This content requires Flash Player 10 or higher.
This diagram shows how a drug molecule crosses cell membranes and the possible routes it may take through the body to get to its target site:
Let's take a closer look at protein binding in the following diagram:
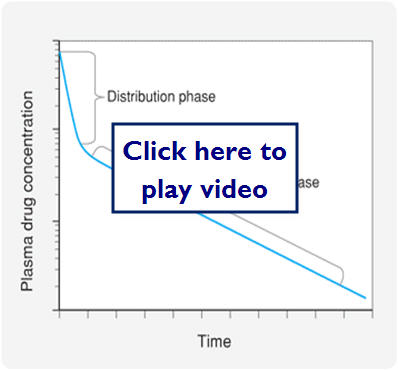
- Kinetics of drug distribution
- Most drugs distributed rapidly from the systemic circulation to other compartments in the body
- This accounts for the sharp decrease in plasma drug concentration after an IV bolus
- The decline continues, but not nearly as fast because drug from tissues can diffuse back into blood as drug is eliminated
Let's look at a graphic representation of this:
![]()
![]()
![]()
Metabolism
- Metabolism
- Liver, GI, lungs, skin, and kidneys
- Liver has the highest and most diverse metabolic enzymes
- Hepatic enzymes can chemically modify a variety of substituents on drug molecules (biotransformation), which can make the drugs inactive or facilitate its elimination
- 2 types of biotransformation
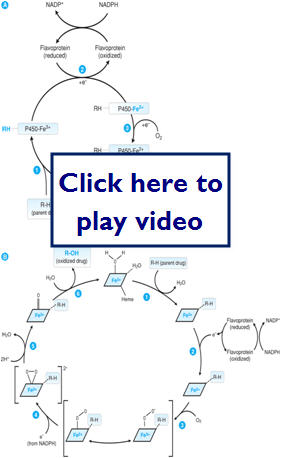
- Phase I (oxidation/reduction reactions)
- Phase II (conjugation/hydrolysis reactions)
- Oxidative/reduction reactions
- Facilitated mostly through the CYP450
- Some prodrugs take advantage of this metabolism
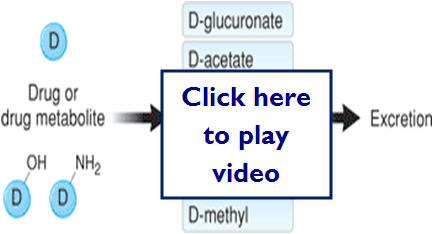
- Cojugation/Hydrolysis reactions
- Hydrolyze or conjugate a drug to a large polar molecule to inactivate or to enhance solubility and excretion in the urine or bile
- Glucuronate, sulfate, glutathione, and acetate are most commonly added
- More details next chapter
Let's take a look at how drugs are metabolized by the body:
Excretion
- Excretion
- Most drugs excreted through renal (more) or biliary (hepatic) excretion (less)
- Some unabsorbed drugs eliminated in feces
- Some respiratory and dermal
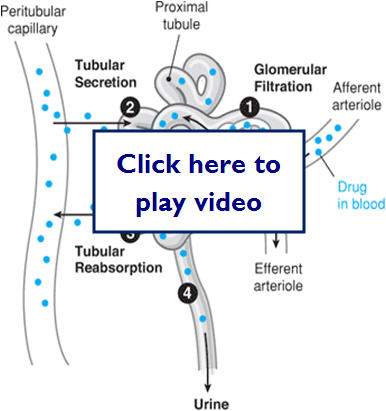
- Renal excretion
- Renal blood flow 25% of systemic blood flow
- Rate of elimination through kidneys depends on
- Filtration, secretion and reabsorption rates
Let's take a look at a diagram of where renal secretion and reabsorption take place:
- Biliary excretion
- Drugs can be reabsorbed, because the bile duct enters the GI tract in the duodenum and drugs must pass through small and large intestine before being eliminated.
- Enterohepatic circulation-drugs get reabsorbed in the GI and retained in the portal and then systemic circulation.
Let's take a look at how drugs are excreted by the body:
![]()
This content requires Flash Player 10 or higher.
Please read the following journal article to help understand why we need to be concerned with kinetics from a clinical viewpoint. Click here to download the article.
- Clinical applications
- Drug clearance is the parameter that limits the time a drug has at its molecular, cellular and organ targets. Rate of elimination of the drug from the body is relative to the concentration of drug in the plasma. Metabolism and excretion can be thought of as clearance mechanisms.
- Metabolism and Excretion kinetics
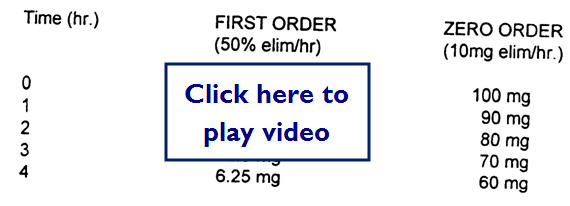
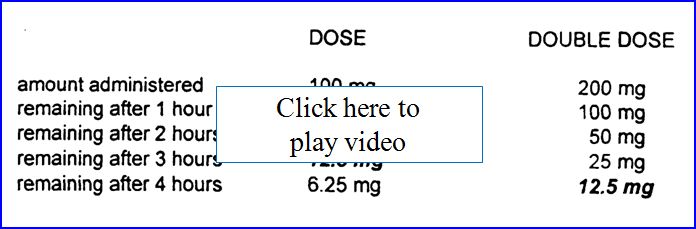
- Most drugs demonstrate first-order kinetics. Amount of drug that is eliminated in a given amount of time is directly proportional to the concentration of drug in circulation at that time (constant T1/2). Some drugs (phenytoin, ethanol) demonstrate saturation or zero order kinetics. Once saturated, the amount of drug eliminated stays constant regardless of the drug concentration in circulation. Can result in toxic or lethal effects!
Below is a comparison table of first order versus zero order drug concentrations remaining as time passes.
Half-LIfe (T 1/2)
Half-Life (T1/2) is the amount of time over which the drug concentration in the plasma decreases to ½ its original value. Because most drugs are eliminated by first order kinetics and the body can be considered a single compartment with a volume equal to that of the Vd, T1/2= 0.693xVd/clearance.
- T1/2 must be considered when designing a dosing regimen
- T1/2 of chloroquine=1 week
- T1/2 of amiodarone = 1 month
- Factors affecting T1/2
- Effects on Vd
- Aging-decreased muscle mass and distribution
- Obesity-increased adipose and distribution
- Pathological fluid-increased distribution
- Effects on clearance
- P450 induction-increased metabolism
- P450 inhibition-decreased metabolism
- Cardiac failure-decreased clearance
- Hepatic failure-decreased clearance
- Renal failure-decreased clearance
- See table 3-5 pg. 44
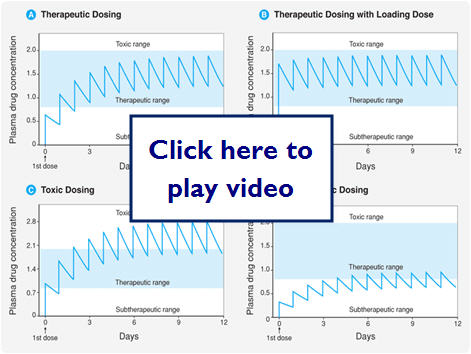
Therapeutic Dosing and Frequency
Therapeutic dosing goal is to maintain peak plasma concentration below the toxic concentration and the trough concentration above the minimum effective concentration (MEC). Steady State (SS) is reached after 4-5 half-lives for most drugs.
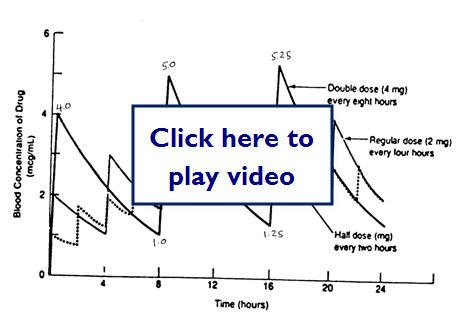
Does doubling the dose double the concentration?
Let's take a look at some examples of medication dosing:
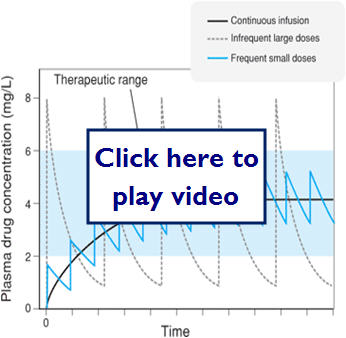
Let's look at what effect different dosing methods could have:
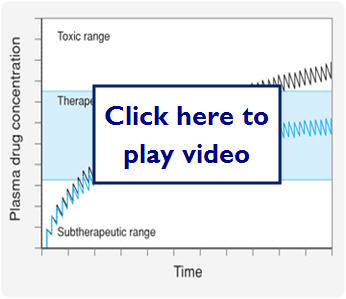
Here we see what effect zero order (saturation kinetics) can have on dosing:
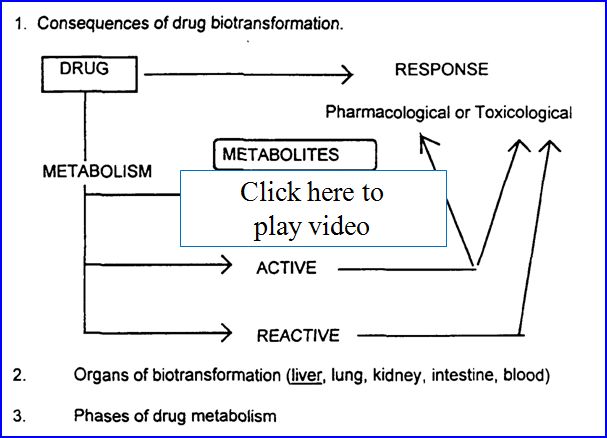
- Drug metabolism (biotransformation)
- Process by which the body alters drugs
- Drugs can be changed in 4 major ways
- Active drug to inactive drug
- Active drug to active or reactive (toxic metabolite)
- Inactive prodrug to active drug
- Unexcretable drug to excretable
Possible outcomes of metabolism:
- Recall from earlier 2 major types of biotransformatiom
- Phase I (oxidation/reduction reactions)
- Phase II (conjugation/hydrolysis reactions)
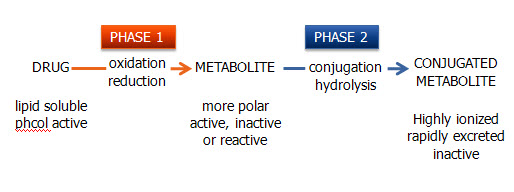
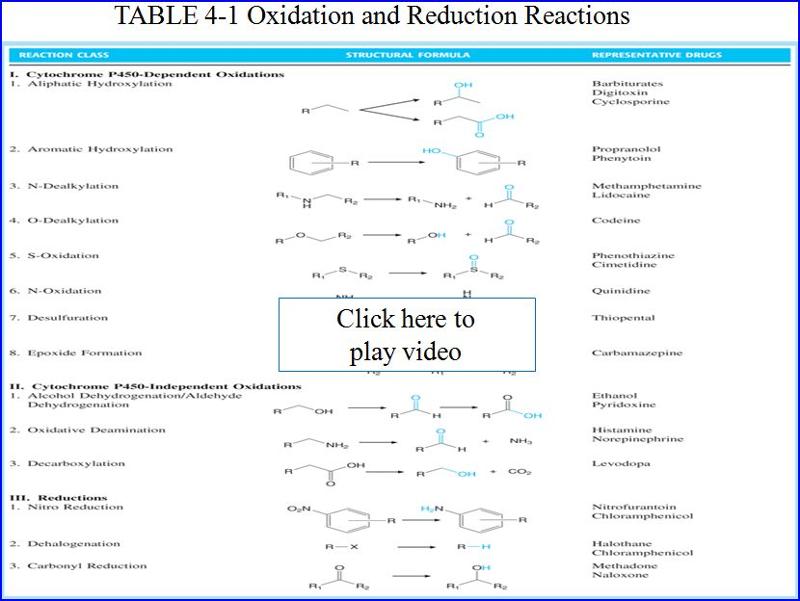
Here are some examples of Phase 1 (oxidative/reduction) metabolism by CYP 450
Here are some examples of Phase 2 metabolism (conjugation reaction)
- Liver is the main organ of drug metabolism
- Don't forget other organs do play roles in drug metabolism lungs, skin, GI etc.
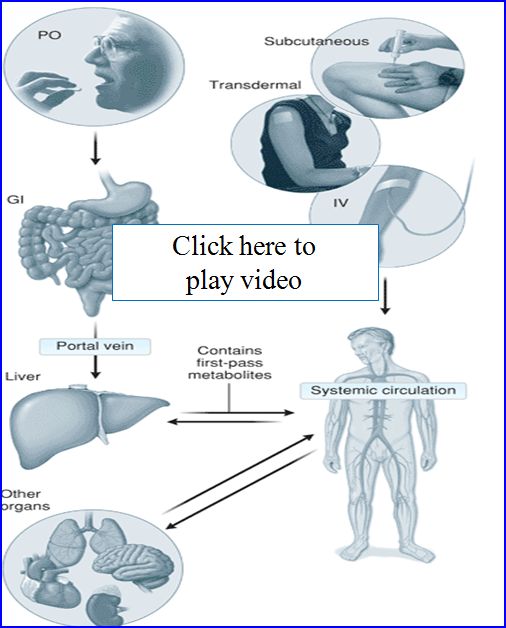
- First pass effect
- After oral administration, drug is absorbed in the GI it gets transported through the portal vein to the liver
- As we now know the liver metabolizes drugs and therefore drugs can undergo metabolism before ever reaching the systemic circulation
- Oral Lidocaine bioavailability only 3%
Let's take a look at the first path effect and some ways to get around the problem:
- Drug transport
- Many drugs need to be actively transported into cells
- Several key molecules help facilitate this
- P-Glycoprotein
- key in intestine
- Organic anion transporting polypeptide (OATP)
- Organic cation transporter (OCT)
- Important in 1st pass effect and statin (HMG-CoA) metabolism
- Organic anion transporter (OAT)
- Important for renal secretion (antibiotics, NSAIDs)
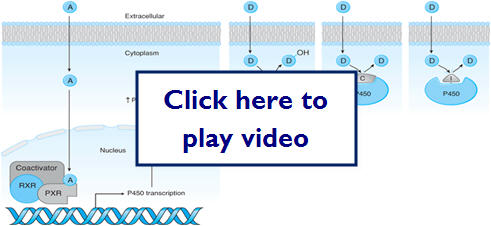
- Induction and Inhibition of metabolizing enzymes
- Induction- will decrease drug concentration
- Inhibition- will increase drug concentration
- Auto-induction-when drug itself induces the metabolism of itself through the enzymes
- Good tables in book on page 57,58
- Rates of biotransformation vary greatly between Pt to Pt
Here is a diagram showing enzyme induction and inhibition of cyp450 enzymes:
Pharmacogenomics
- Pharmacogenomics
- The study of genetic variability on drug metabolism
- Certain population have polymorphisms or mutations in their metabolizing enzymes, which can greatly affect drug kinetics for those PTs
- Slow metabolizers
- Fast metabolizers
- Race and Ethnicity
- Age and gender
- Diet and environment
Drug-Drug Interactions
- Drug-Drug interactions
- Increase when 2 or more drugs are administered that require metabolism via the same enzymes
- Compete for same enzyme and reduce the overall metabolism
- Can increase concentration of one or both drugs and increase adverse events
- Disease can affect metabolism
- Can change the rate or extent of drug metabolism
- Any disease of the liver can have impact on CYP450 enzymes
- Hepatitis, cirrhosis, cancer
- Cardiac disease can often decrease metabolism
- Thyroid disease can increase or decrease metabolism
![]()
![]()
![]()
![]()
![]()
![]()
