
Pharmacodynamics
- Pharmacodynamics-the effects of a drug on the body
- Drug-receptor
- Needed to determine
- Dose ranges
- Compare potency
- Efficacy
- safety
Dose Response Relationships
- Relationship between dose (drug concentration) and the PTs response to the drug.
- In general the response to a drug is proportional to the concentration of receptors that are occupied by the drug.
Let's look at what dose-relationship curves look like on a linear and semi-logarithmic scale:
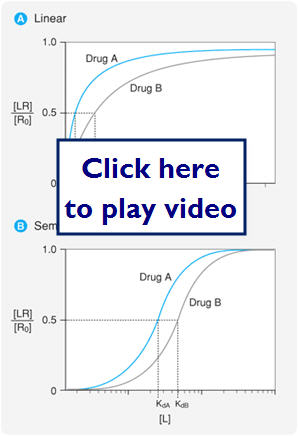
- 2 major types of dose-response relationships
- Graded-effect that various doses (concentrations) of drug have on an individual
- Heart rate, BP
- Quantal-effect of various doses on a population of individuals ( looks at a response to the dose)
- Sleep or no sleep, alive at 6 months or dead at 6 months
Let's first look at G-graded dose response curves:
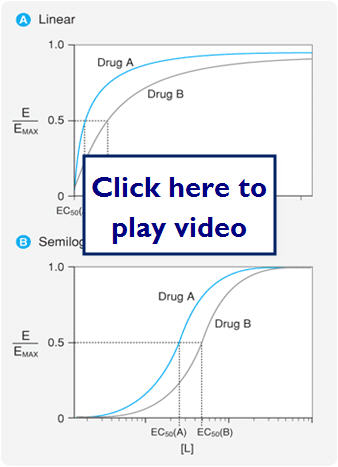
- 2 important parameters
- Potency (EC50)- concentration at which the drug elicits 50% of its max response
- Can compare the potency of 2 drugs by comparing the EC50s of the 2 drugs
- ACH EC50=12 PrCH EC50=180
- 180/12=15 therefore ACH is 15x more potent than PrCH
- Efficacy (Emax) is the maximal response produced by the drug
Now we'll look at Quantal dose response curves and critical points used in determining dosing and safety:
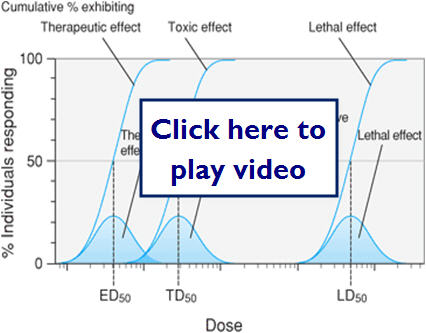
- Quantal dose-response relationships
- The responses are defined as present or not present (sleep or no sleep) versus a graded response such as heart rate.
- Important parameters for quantal responses
- Therapeutic effect
- Median effective dose (ED50)
- Adverse effect (toxic effect)
- Median toxic dose (TD50)
- Lethal effect
- Median lethal dose (LD50)
Let's revisit our drug receptor complex equation and the relationships it represents:

drug + receptor  drug-receptor cplx.
k1 = association constant
k2 = dissociation constant
k1 / k2 = AFFINITY
k3 = EFFICACY
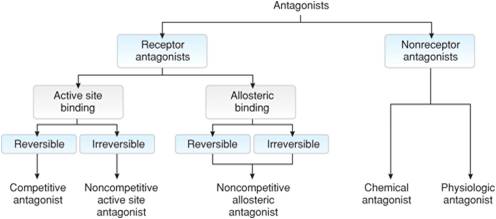
Types of Agonists/Antagonists
- Agonist-molecule that binds to a receptor and stabilizes it in a particular conformation (usually the active confirmation)
- Antagonist-molecule that inhibits the action of an agonist, but has no effect in the absence of the agonist
- Can bind to the receptors active site or can bind to an allosteric site
- Can be reversible or irreversible
- Competitive antagonists-binds reversible to the active site of the receptor
- Maintains receptor in the inactive conformation and blocks the agonist from binding (reduces potency), but can be pushed off receptor
- Noncompetitive antagonists-bind to either the active site or the allosteric site
- If binds to the active site effectively irreversible
- Can't be pushed off or out competed for by the agonist
- Aspirin- irreversibly inhibits cyclo-oxygenase
- If binds to the allosteric site it prevents the receptor from being activated even if the agonist binds (reduces efficacy)
- Nonreceptor antagonists
- Chemical- modifies or sequesters the agonist so it can't bind to the receptor
- Physiological- activates or blocks a receptor that mediates a physiological response opposite of the agonist
- Hyperthyroid (tachycardia)- block sympathetic stimulation
- Partial agonists-when binds to the active site only produces a partial response even if all receptors are occupied
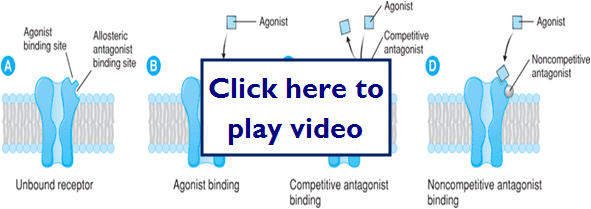
This diagram highlights the possible site for antagonist binding:
This diagram shows different types of antagonist binding and their effect on the agonist binding:
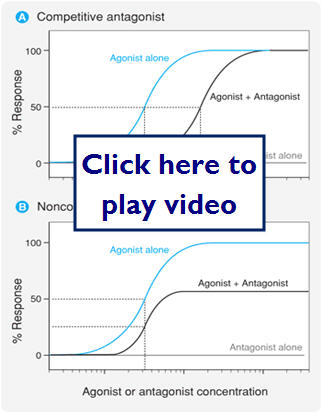
Let's take a look at a graphic representation of several types of binding and the outcomes of the overall therapeutic effect:
Let's now look at a comparative diagram of full versus partial agonists:
- Inverse Agonists- acts to nullify the intrinsic activity of unoccupied receptors
- When compared to competitive antagonists
- Both reduce receptor activity
- Both reduce full agonist potency
- Differ in that competitive antagonists have no effect without the presence of an agonist, whereas the inverse antagonist deactivates receptors that are normally active in the absence of an agonist
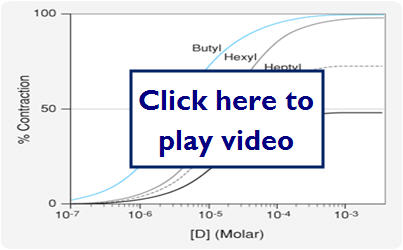
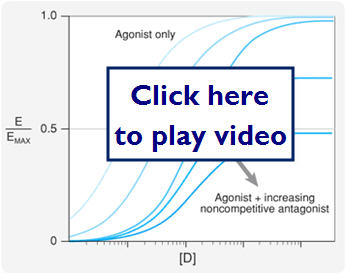
- Spare Receptors
- Situation where max effect is seen before all receptors are occupied
- Changes the dose response curve in response to a noncompetitive antagonist
- The max effect may still be achieved in response to low concentrations of an antagonist
In this diagram we will look at the effect spare receptors can have on the effectiveness of an antagonist.
- Therapeutic window-range of drug concentrations that deliver a therapeutic response without toxicity or the drug concentration between the toxic dose and the effective dose
- Therapeutic Index-is the ratio of TD50/ED50
- Large number represents a large therapeutic index and relates the safety of the drug
- A small number indicates a narrow therapeutic index and these drugs require careful dosing and quite often monitoring for the patients safety
Self Check Questions: Pharmacodynamics
![]()

![]()
![]()
![]()
![]()
![]()
